| |
Welcome to the | |
| |
AACES-1 Project | |
| Australian Airborne Cal/val Experiment for SMOS |
|
Home page
Google Earth (KML file) Workplan SMOS AMSR-E WindSat ASCAT PALSAR ASAR MODIS MTSAT-1R ASTER Landsat CHRIS AVNIR-2 PLMR data Thermal Infrared data Multi-Spectral data Monitoring stations Soil moisture sampling Vegetation sampling Roughness sampling Campaign shapefiles DEM Land use Climate data Rainfall data Soil classification Soil water capacity Soil texture analysis AACES homepage Moisturemap homepage |
Multi-Spectral data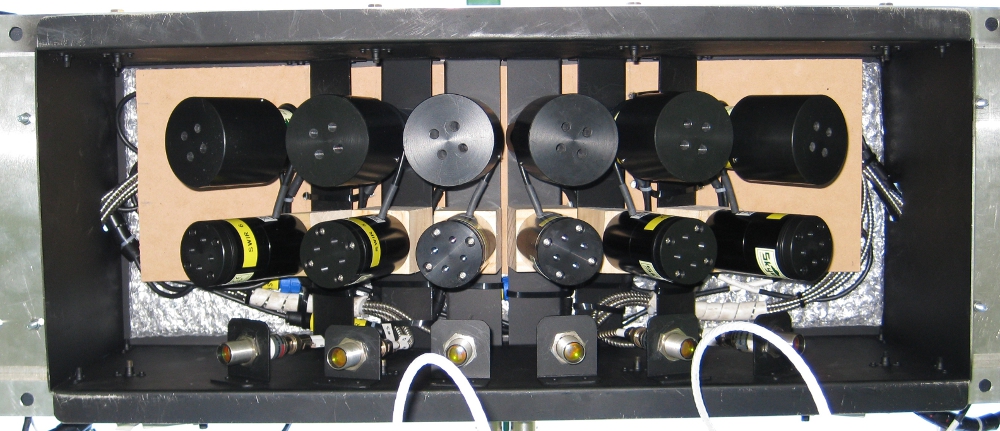 Sensor box with 12 multi-spectral sensors (two upper rows) and 6 thermal infrared sensors (bottom row)
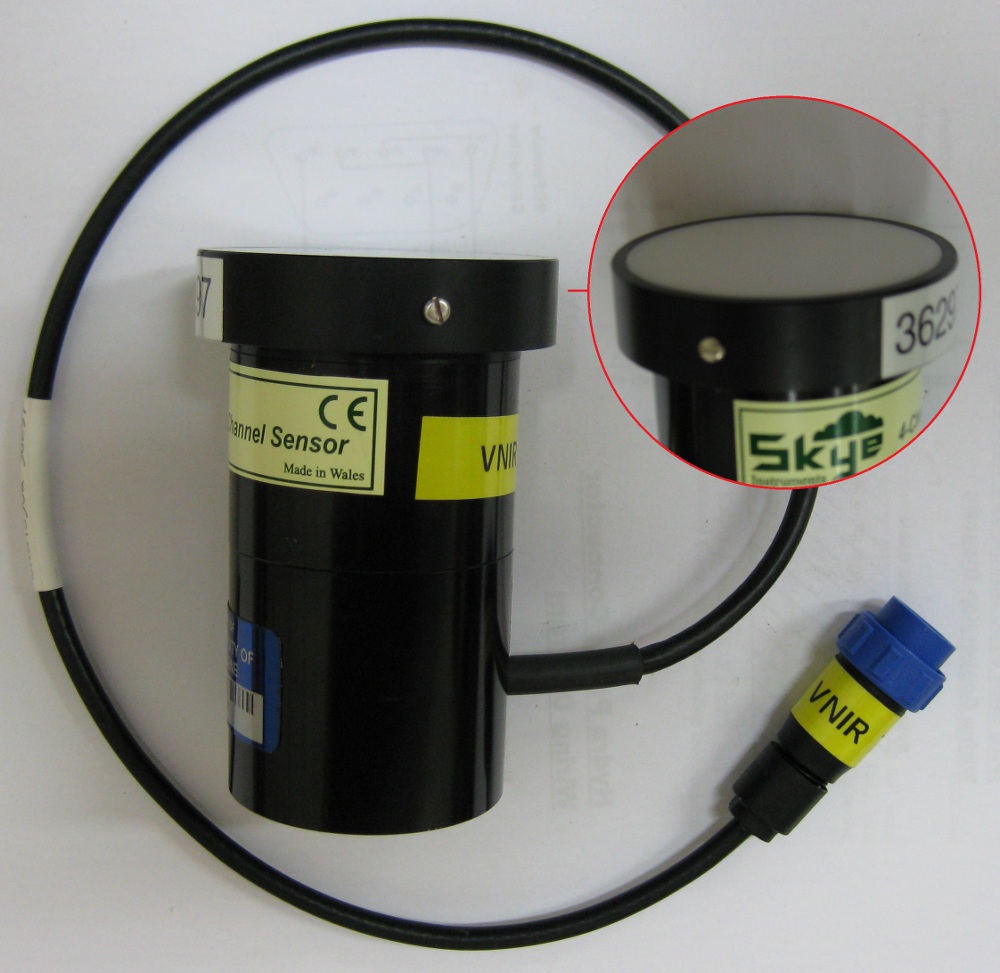
 VNIR sensor (downward)
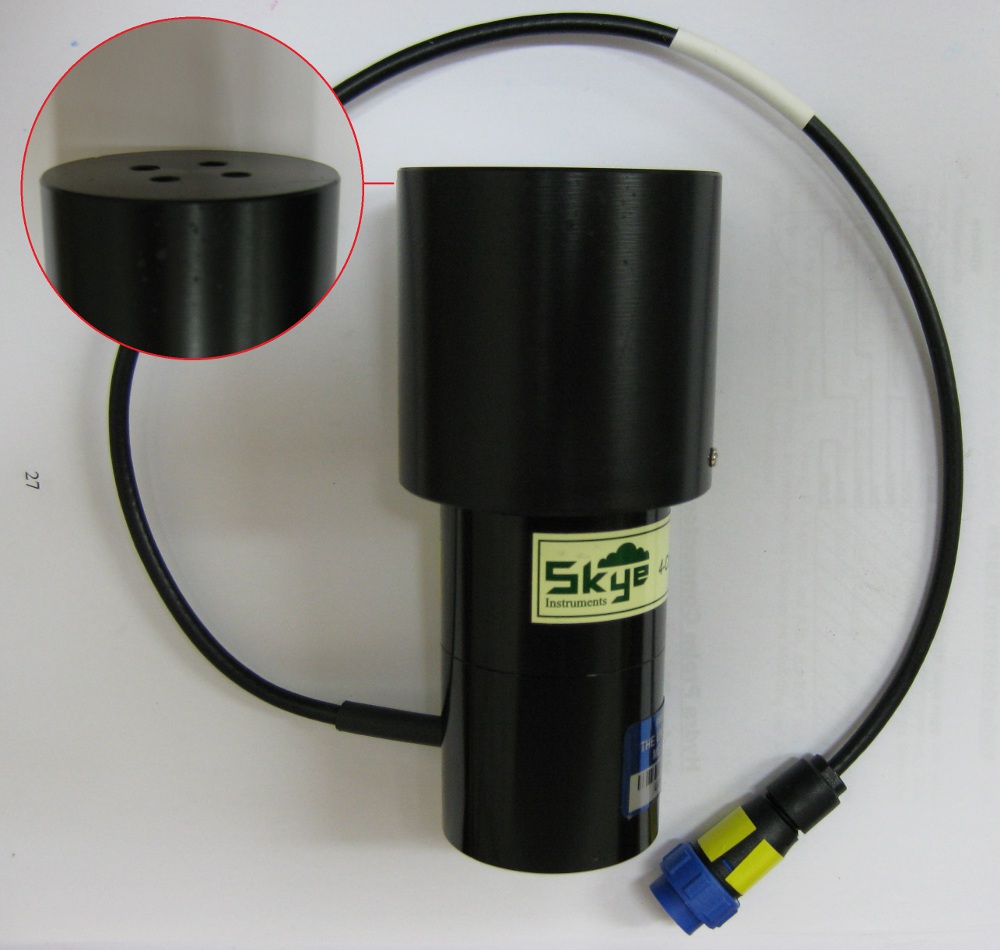
 VNIR sensor (upward)
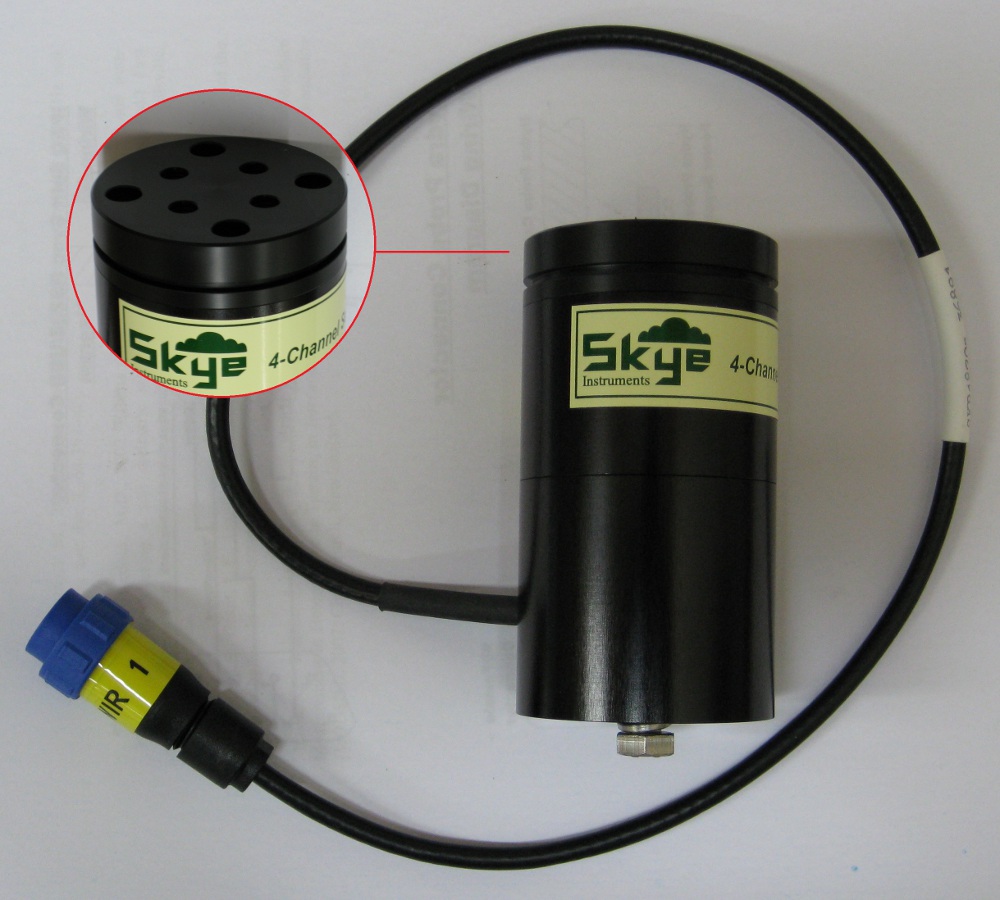 SWIR sensor (downward)
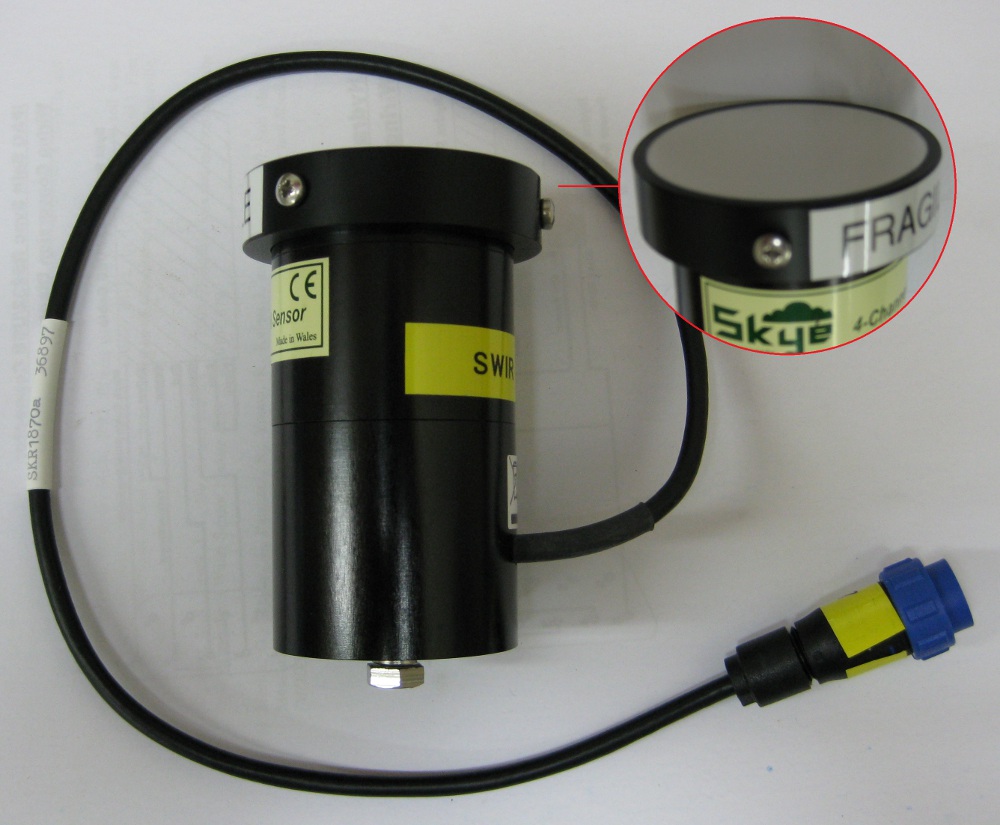 SWIR sensor (upward)
The multi-spectral measurements are made using an array of 15° FOV Skye 4-channel sensors, each with 0-5 V signal output. When installed, these sensors are configured in a similar way to the Everest thermal infrared radiometers (bottom row in first picture), such that the six downward-looking sensors have the same incidence angle and footprints as the six PLMR beams. However, to correct for incident radiation, an upward-looking sensor with cosine diffuser is also installed. Each sensor weighs approximately 400g and has a size of 8.2cm × 4.4cm without the cosine diffuser or field of view collar attached). Two arrays of 4 channel sensors are installed, with the following (matched) spectral bands:
NDVI observationHere is an example showing the NDVI distribution over focus farm 09, flight patch 05. All collected data can be downloaded via the Download Centre. 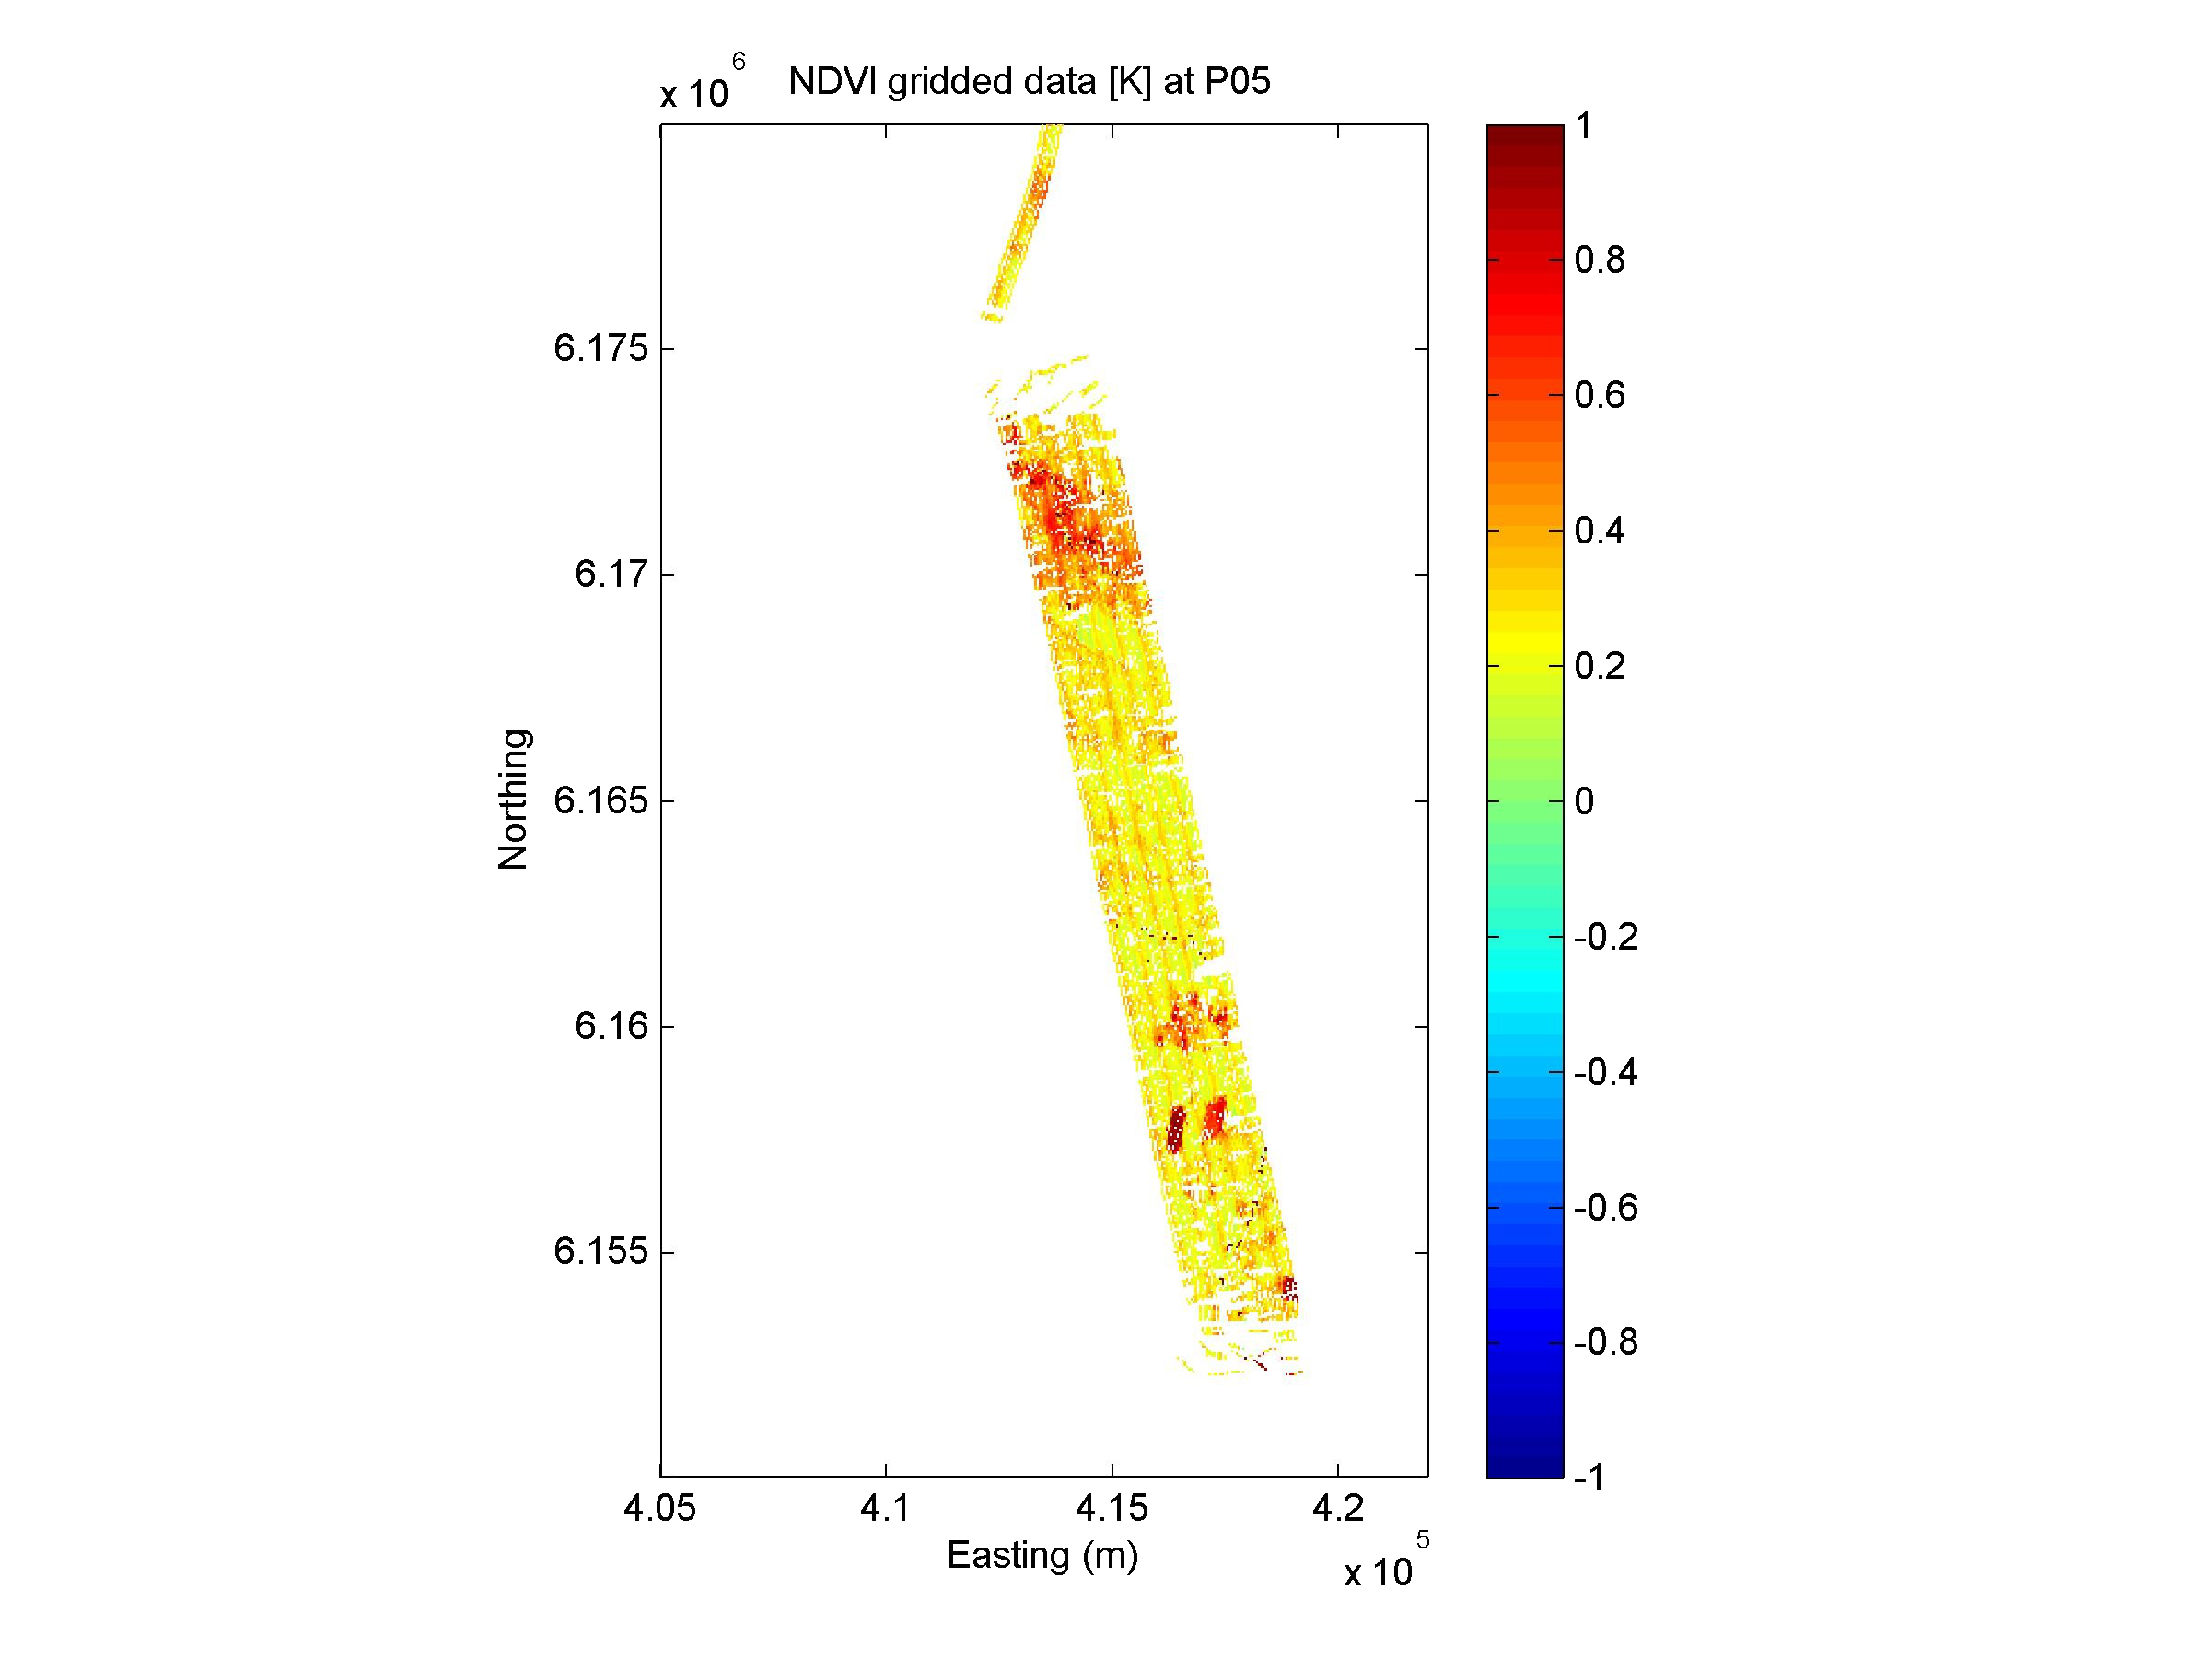
|
||||||||||||||||||||||||||||||
|
Created: January 2010 Last Modified: August 2010 Maintainer: YE Nan, Ye.Nan@monash.edu |